Publishing a newsletter is a lot of work. Creating a brand-new infographic for each issue/topic is also a lot of work. This is obvious to anyone who has tried either one.
But this wasn’t all I learned by starting this newsletter last year. As you’ll see in the infographic below, there are things I learned about publishing, subscribers, and views that could be useful to others who are thinking of publishing a weekly newsletter.
I originally started this newsletter for two reasons:
- I wanted to be creative and try new things with design
- I wanted to share the great info I was learning in these podcasts
For the first aspect, the challenge I gave myself was that each infographic had to be unique, and it couldn’t be “on brand” for either the podcast or the guest. This forced me to create a completely new style (fonts, colors, styling, etc) each time. There are some similar themes that I follow, but I tried to do something unique each time with varying degrees of success.
For the second aspect, I learned so much! We’ve all listened to podcasts, heard something great we wanted to share with someone, … and then forgot it. This newsletter has forced me to really focus on what is being said so that I can pass that info along to you.
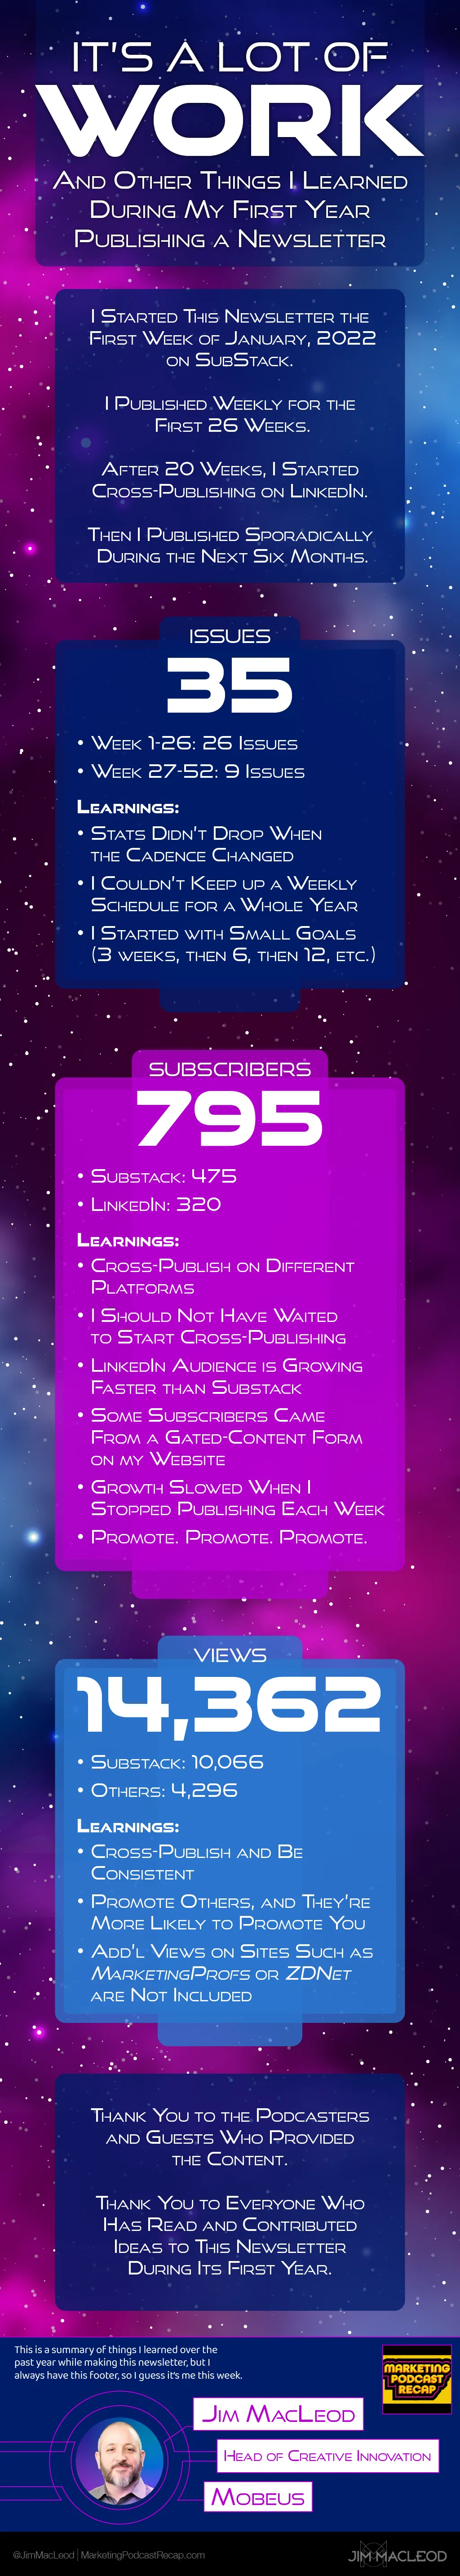
Other things I learned:
- LinkedIn compresses the hell out of my images. I hope to have this fixed moving forward.
- It’s great when other sites republish these infographics. For example, MarketingProfs, and again, and again. ZDNet, and others.
- Going on podcasts to promote the newsletter helps a lot (Unemployable and #TimTalk). Going to creator-driven events like the Creator Economy Expo helped a lot, too.
- Talking about other things and having it link back to the newsletter can be very beneficial. Welcome to the many new subscribers that are here due to Mark Schaefer’s popular post on uses for ChatGPT.
- More comments/reactions = more views. Especially on LinkedIn. The top five most viewed posts on LinkedIn are in the top six for most comments.
I hope you’ve found it interesting. It seems a good number of you read these on a regular basis. My SubStack subscribers/view rate is pretty good. My LinkedIn subscribers/views rate is very good. I wish there were better analytics for both platforms.
Here’s a quick video that gives some additional color on some of these stats.
The comments and replies I receive are the motivation to keep this going! If you have any questions about anything else I might have picked up along the way, please let me know.
Thanks for skimming.
-Jim


